If you’ve ever run kubectl get events and wished those events didn’t vanish after an hour, keep reading. Kubernetes events tell you exactly what’s happening in your cluster (pod scheduling failures, image pull errors, OOM kills), but by default they disappear from etcd after 60 minutes.
This guide walks through why that’s a problem and how to export events to the tools your team already uses.
What are Kubernetes events?
Every time something happens in your cluster, Kubernetes creates an Event object. A pod gets scheduled, a container crashes, a volume fails to mount. Events are first-class API resources, same as Pods or Deployments.
Here’s what one looks like:
apiVersion: v1
kind: Event
metadata:
  name: my-app-pod.17a6f8e2c
  namespace: production
reason: BackOff
message: "Back-off restarting failed container"
type: Warning
involvedObject:
  kind: Pod
  name: my-app-pod
  namespace: production
count: 15
firstTimestamp: "2026-03-07T10:00:00Z"
lastTimestamp: "2026-03-07T10:15:00Z"
The useful fields:
- Reason: Machine-readable cause (
BackOff,FailedScheduling,Unhealthy,Pulling,Killing) - Type: Either
NormalorWarning - Message: Human-readable description of what happened
- InvolvedObject: The resource this event is about
- Count: How many times this event has occurred
Why the defaults are a problem
Three things make stock Kubernetes events nearly useless for debugging:
Events expire after 1 hour
The API server retains events for 60 minutes. A pod crash at 2 AM is gone by 9 AM. You’re left guessing.
No search or aggregation
kubectl get events gives you a flat, unsorted list. No cross-namespace search, no severity filtering, no time correlation. Just a wall of text.
No alerting
Kubernetes won’t tell you when something goes wrong. A FailedScheduling event could fire hundreds of times before anyone notices, unless someone happens to be watching.
Export events to external systems
The fix is an event exporter: a lightweight component that watches the Kubernetes event stream via the API server and forwards events to external destinations (sinks) like Elasticsearch, Slack, Loki, Kafka, or webhooks.
The pipeline:
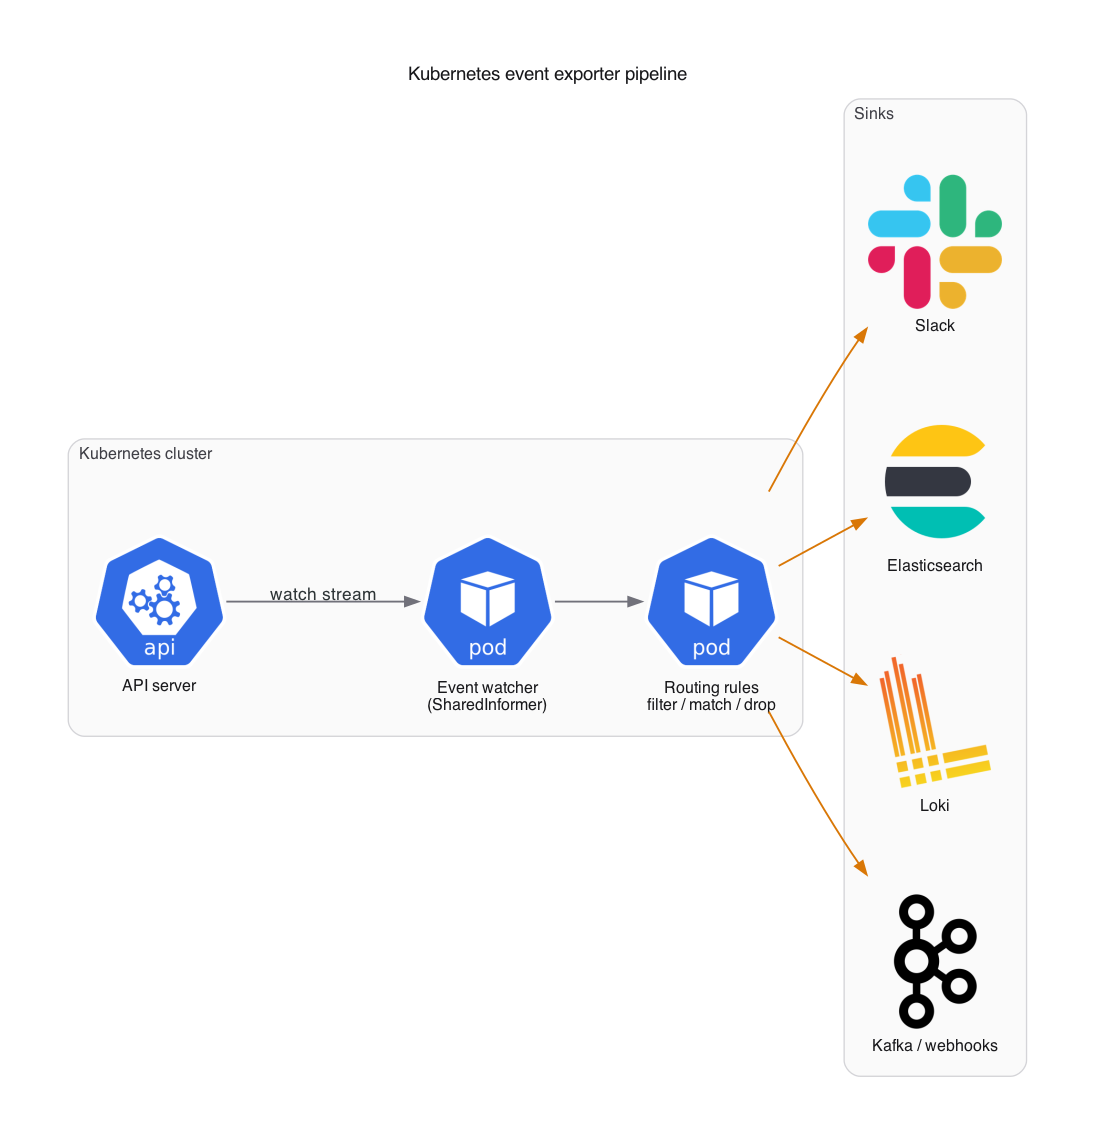
The exporter uses a SharedInformer to watch events without polling, applies configurable routing rules, and delivers them to one or more sinks.
Setting up the exporter
The Ownkube Kubernetes Events Exporter is a fork we maintain. The upstream project by Opsgenie (later Resmo) has been dormant since 2023 and has some bugs that cause silent event loss. More on that later.
Install with Helm
helm install event-exporter \
  oci://ghcr.io/ownkube/charts/kubernetes-events-exporter \
  --namespace monitoring \
  --create-namespace
Basic configuration
The exporter takes a YAML config (deployed as a ConfigMap). A minimal config that sends everything to stdout:
logLevel: info
route:
  routes:
    - match:
        - receiver: "stdout"
receivers:
  - name: "stdout"
    stdout: {}
Routing
You can filter and direct events to different sinks based on any event property: namespace, event type, reason, involved object kind, etc.
Route warning events to Slack
route:
  routes:
    - match:
        - receiver: "slack-warnings"
      match:
        kind: ".*"
        type: "Warning"
    - match:
        - receiver: "elasticsearch"
receivers:
  - name: "slack-warnings"
    slack:
      token: "${SLACK_TOKEN}"
      channel: "#k8s-alerts"
      message: |
        *{{ .Reason }}* in {{ .InvolvedObject.Namespace }}/{{ .InvolvedObject.Name }}
        ```{{ .Message }}```

  - name: "elasticsearch"
    elasticsearch:
      hosts:
        - "https://elasticsearch:9200"
      index: "k8s-events"
Drop noisy events
Some events are just noise. Drop them before they hit any sink:
route:
  drop:
    - type: "Normal"
      reason: "LeaderElection"
    - namespace: "kube-system"
      reason: "ScalingReplicaSet"
  routes:
    - match:
        - receiver: "elasticsearch"
Route by namespace
Production events go to PagerDuty. Staging events go to Slack. Everything goes to Elasticsearch.
route:
  routes:
    - match:
        - receiver: "pagerduty-webhook"
      match:
        namespace: "production"
        type: "Warning"
    - match:
        - receiver: "slack-staging"
      match:
        namespace: "staging"
    - match:
        - receiver: "elasticsearch"
Sink examples
The exporter supports 30+ sinks. Here are the ones most people use.
Elasticsearch
Store all events for long-term analysis and Kibana dashboards:
receivers:
  - name: "elasticsearch"
    elasticsearch:
      hosts:
        - "https://elasticsearch.monitoring:9200"
      index: "k8s-events"
      username: "${ES_USER}"
      password: "${ES_PASSWORD}"
      useEventID: true
Loki
Feed events into Grafana Loki for log-style querying:
receivers:
  - name: "loki"
    loki:
      url: "http://loki.monitoring:3100/loki/api/v1/push"
      streamLabels:
        app: "kubernetes-events"
      basicAuth:
        username: "${LOKI_USER}"
        password: "${LOKI_PASSWORD}"
Slack
receivers:
  - name: "slack"
    slack:
      token: "${SLACK_TOKEN}"
      channel: "#k8s-events"
      message: |
        *{{ .Type }}* event on *{{ .InvolvedObject.Kind }}* `{{ .InvolvedObject.Name }}`
        Namespace: `{{ .InvolvedObject.Namespace }}`
        Reason: `{{ .Reason }}`
        Message: {{ .Message }}
Kafka
receivers:
  - name: "kafka"
    kafka:
      brokers:
        - "kafka-broker:9092"
      topic: "kubernetes-events"
      tls:
        enable: true
Webhook
Send events to any HTTP endpoint:
receivers:
  - name: "webhook"
    webhook:
      endpoint: "https://your-api.example.com/k8s-events"
      headers:
        Authorization: "Bearer ${WEBHOOK_TOKEN}"
        Content-Type: "application/json"
Prometheus
Turn events into Prometheus metrics for alerting with Alertmanager:
receivers:
  - name: "prometheus"
    prometheus:
      labels:
        - "reason"
        - "type"
        - "involvedObject.kind"
        - "involvedObject.namespace"
Events worth watching
Not all events matter equally. These are the ones that usually point to real problems.
Pod lifecycle issues
| Reason | Type | What it means |
|---|---|---|
BackOff | Warning | Container keeps crashing and restarting |
Unhealthy | Warning | Liveness or readiness probe failed |
OOMKilling | Warning | Container exceeded memory limits |
FailedMount | Warning | Volume couldn’t be mounted |
ErrImagePull | Warning | Can’t pull the container image |
Scheduling problems
| Reason | Type | What it means |
|---|---|---|
FailedScheduling | Warning | No node has enough resources |
Preempting | Normal | Pod is being preempted for a higher-priority pod |
NotTriggerScaleUp | Warning | Cluster autoscaler can’t add nodes |
Node issues
| Reason | Type | What it means |
|---|---|---|
NodeNotReady | Warning | Node is unhealthy |
EvictionThresholdMet | Warning | Node is running low on resources |
Rebooted | Warning | Node was rebooted |
Practical tips
Drop noise early
Leader election events, successful image pulls, and routine scaling events generate a lot of volume. Drop them at the top of your routing tree. Your storage bill and your Slack channel will thank you.
Don’t hardcode secrets
The exporter supports ${ENV_VAR} syntax. Use it with Kubernetes Secrets:
env:
  - name: SLACK_TOKEN
    valueFrom:
      secretKeyRef:
        name: event-exporter-secrets
        key: slack-token
Separate sinks for separate jobs
- Elasticsearch or Loki for historical analysis
- Slack for real-time awareness of warnings
- Webhook or PagerDuty for on-call alerting
- Prometheus for dashboards and SLO tracking
Run with leader election
If you’re running multiple replicas, enable leader election so only one instance processes events:
leaderElection:
  enabled: true
  leaderElectionID: "event-exporter-leader"
Monitor the exporter itself
It exposes Prometheus metrics at /metrics. Set up alerts for high error rates on sink delivery, event processing lag, and exporter pod restarts.
Why we maintain this fork
The original kubernetes-event-exporter by Opsgenie has been dormant since 2023. We ran into bugs in production and started fixing them. The fork now includes:
- A fix for silent event loss. The upstream only handled add and delete operations, missing updates entirely.
- Accurate event age calculation using
max(EventTime, FirstTimestamp, LastTimestamp)instead of justLastTimestamp, which was causing stale events to get re-exported. - Loki improvements: basic auth, stream label templating, TLS transport fixes.
- A Prometheus sink for converting events directly into metrics.
- Elasticsearch v8 compatibility (the v8 API broke the upstream).
- SNS FIFO support with proper message group IDs.
The full code and Helm chart are on GitHub.
Getting started
- Install the exporter via Helm into your monitoring namespace
- Start with stdout + one sink (Slack or Elasticsearch) to validate routing works
- Add drop rules for the noisy stuff
- Expand sinks as you need them
That’s it. Kubernetes events go from “gone in 60 minutes” to searchable, filterable, and alertable.
If you’d rather skip the plumbing
If you’re running k3s or EKS in your own AWS account, Ownkube wires event routing in by default: warnings into Slack, everything into your logging backend, crashloops explained in plain English, without installing a chart or writing a routing YAML. It runs on your cluster in your AWS account, so the events never leave your perimeter.
Connect your cloud and event monitoring is one of the things you stop thinking about.